Ilkley Town Centre Performance
Premises Type


Figures include businesses with commercial premises only
An independent retailer is defined as having less that 5 branches nationally
Vacancy Rates


Data is for premises in ground floor units within the BID area.
Premises currently available to let in Ilkley are between £17.91 and £21.78 per sq m per month.
Footfall
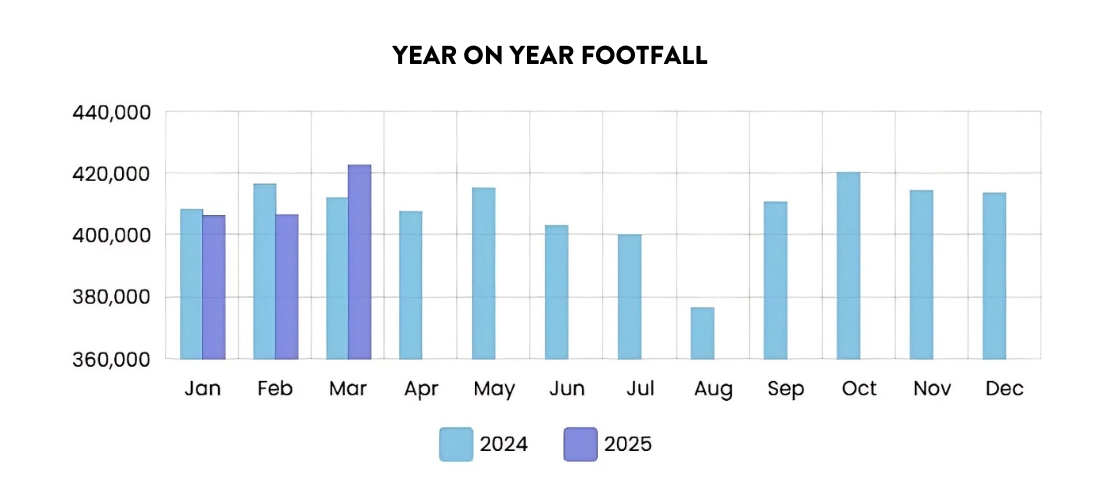
Footfall figures for Ilkley in January & February 2025 were slightly lower than last year which maybe due to the new housing development traffic works. However, March 2025 saw a significant footfall of 422,999.
This figure represents a 4% increase compared to the previous month (February) and is 2.6% higher than the footfall recorded in March 2024.
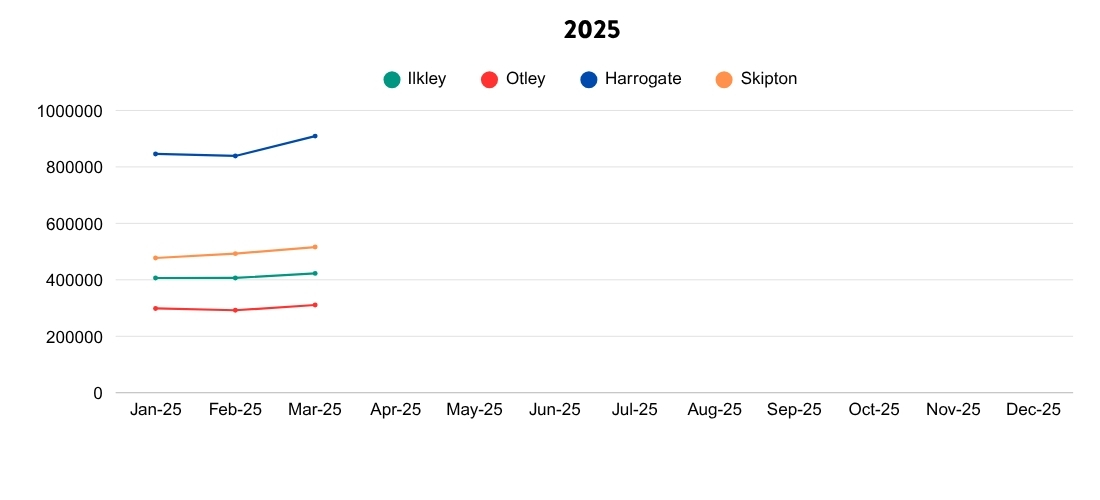
Throughout January and February 2025, Ilkley’s footfall demonstrated a steady performance, consistently ranking between Otley and Skipton. With visitor numbers totalling 406,447 in January and 406,689 in February, Ilkley outpaced Otley (Jan: 298,506, Feb: 292,196) but remained slightly behind Skipton (Jan: 477,342, Feb: 492,651). In comparison, Skipton experienced a modest increase in footfall from January to February, while Harrogate recorded a slight dip in visitor numbers during the same period (Jan: 845,937, Feb: 838,762).
In March 2025, Ilkley’s footfall increased to 422,999, continuing to position it ahead of Otley, which recorded 310,829 visitors. Skipton also saw a rise in footfall to 516,062, maintaining its lead over Ilkley. Meanwhile, Harrogate experienced a notable increase in March with 909,157 visitors.

Quarterly Reports
Monthly Town Centre Performance
-
March 2025
FootfallTotal Footfall: 422,7994% higher than February 2025 and 2.6% higher than March 2024. The majority of visitors to Ilkley in March came from...
-
February 2025
FootfallTotal Footfall: 406,689 2.4% lower than February 2024 which was 416,617 The majority of visitors to Ilkley in February came from the...
-
January 2025
FootfallTotal Footfall: 406,447 0.5% lower than January 2024 which was 408,508 The majority of visitors to Ilkley in January came from the Yorkshire...
-
December 2024
FootfallTotal Footfall: 413,706 Higher than December 2023 which was 407,132 The majority of visitors to Ilkley in December 2024 came from the...
-
November 2024
FootfallTotal Footfall: 414,581Lower than November 2023 which was 419,600. The majority of visitors to Ilkley in November 2024 came from the...
-
September 2024
FootfallTotal Footfall: 410,895Slightly higher than September 2023 which was 409,421. The majority of visitors to Ilkley in September 2024 came from...
-
October 2024
FootfallTotal Footfall: 420,457Slightly lower than October 2023 which was 423,450. The majority of visitors to Ilkley in October 2024 came from the...
-
August 2024
FootfallTotal Footfall: 376,597 Slightly lower than August 2023 which was 381,997. The majority of visitors to Ilkley in August 2024 came from the...
-
July 2024
FootfallTotal Footfall: 400,123Slightly higher than July 2023 which was 394,605. The majority of visitors to Ilkley in July 2024 came from the...
-
June 2024
FootfallTotal Footfall: 403,268 Slightly lower than June 2023 which was 411,122. The majority of visitors to Ilkley in June 2024 came from the...
-
May 2024
FootfallTotal Footfall: 415,379Slightly higher than May 2023 which was 415,291. The majority of visitors to Ilkley in May 2024 came from the...
-
April 2024
FootfallTotal Footfall: 428,804 7.9% higher than April 2023. The majority of visitors to Ilkley in April 2024 came from the Yorkshire and the Humber...
If levy payers need clarification on any data displayed on this page, please get in touch: info@ilkleybid.co.uk